IoT & Data Monitoring Dashboards
Real-time platforms that turn complex data into clear, actionable decisions.
Get actionable Insights
We design and develop custom data platforms that integrate sensors, APIs, and institutional systems into a single, reliable dashboard environment. Our solutions support real-time monitoring, historical analysis, and multi-user decision-making for public administrations, research institutions, and private organizations.
What this service offers
Platforms for digitizing, managing, and sharing cultural and industrial heritage at scale.
Sensor & Data Integration
From sensor setup to live data ingestion and system connectivity across environmental, heritage, and industrial contexts.
User & Organization Management
Multi-role, multi-organization access with white-label-ready configuration.
Backend & Data Architecture
Scalable, secure backend systems with APIs and data pipelines built for long-term growth.
UX for Decision-Making
Role-based dashboard interfaces designed for fast, clear interpretation.
Alerts & Automation
Threshold-based alerts, notifications, and automated reporting.
Real-Time Data
Clear, live visualizations for monitoring, performance tracking, and operational awareness.
Your Data, at a Glance
Real-time dashboards that turn raw sensor data into actionable operational insights.
Map View
Spatial overview of sensors and their current status
Some examples of our work
HortaTech
An IoT-powered dashboard for real-time water resource monitoring and optimization in agricultural heritage sites, combining sustainability with historical preservation.
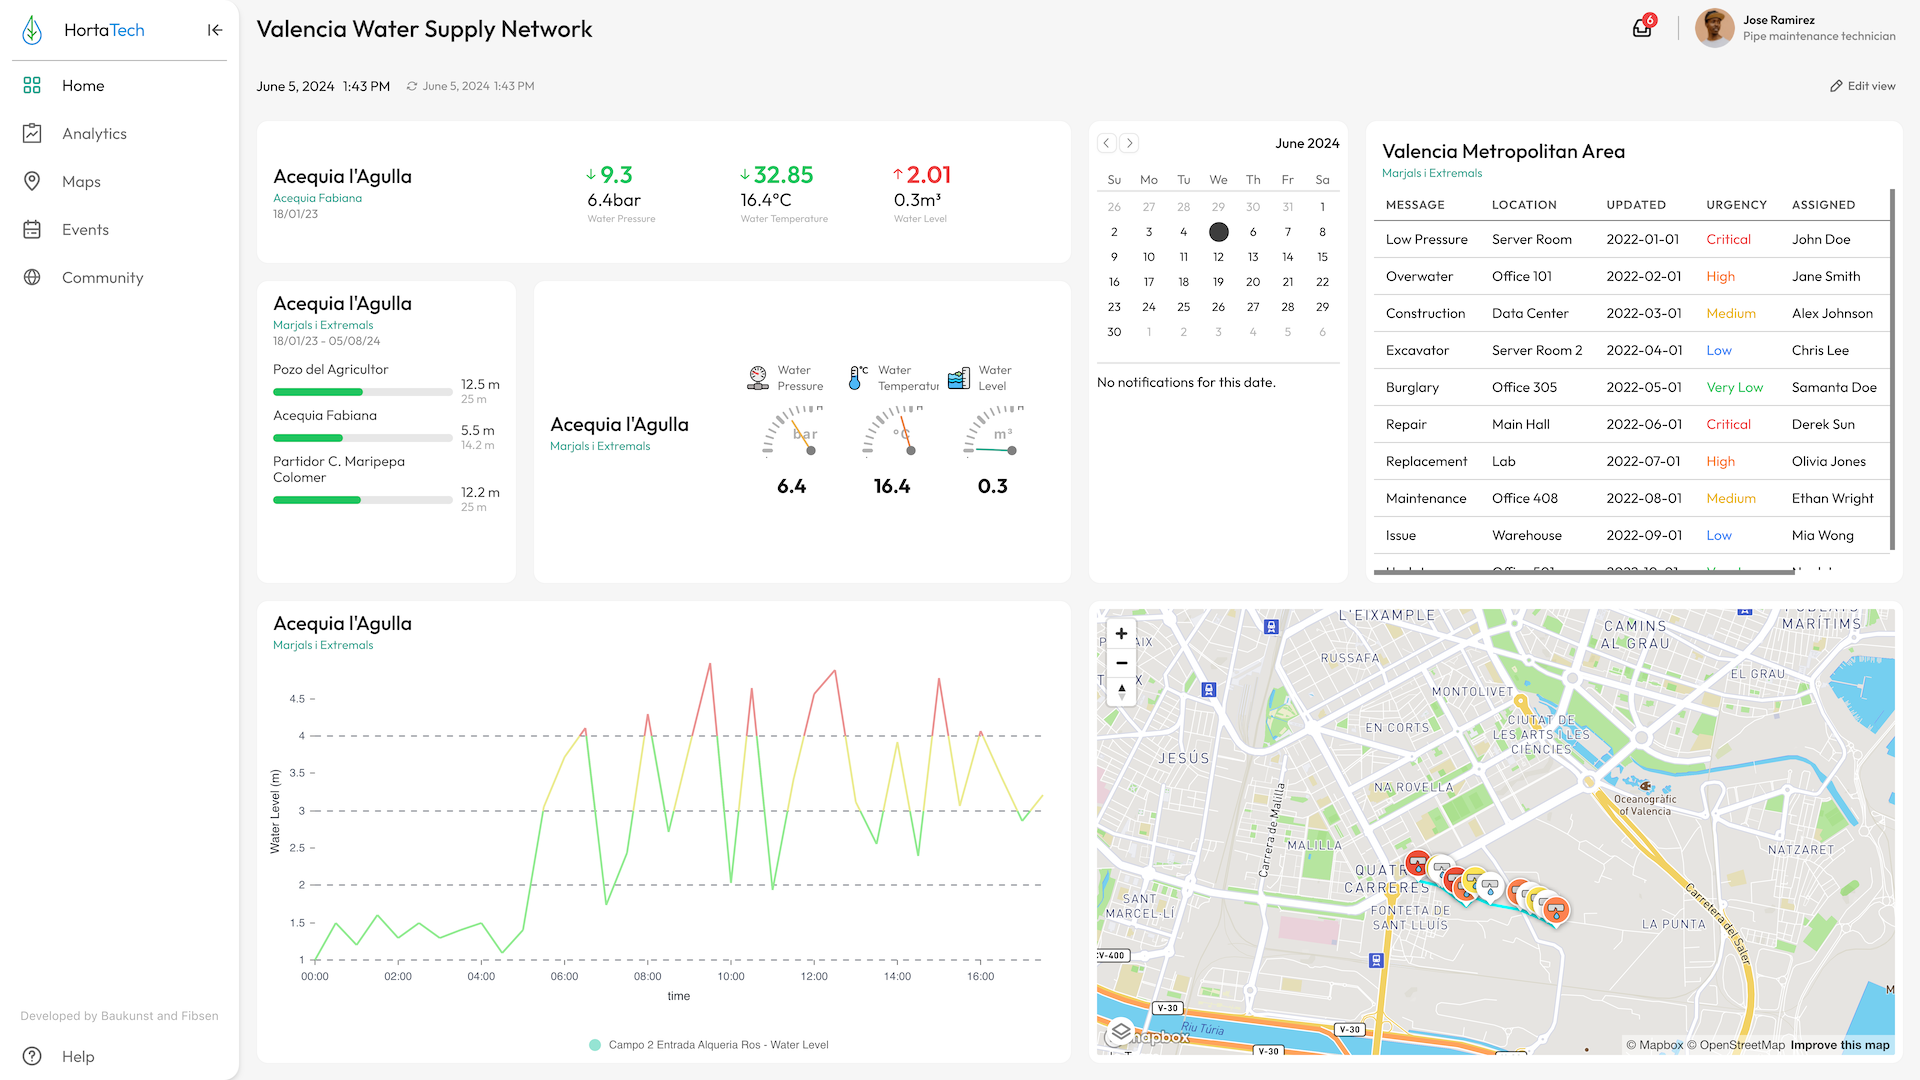
The Problem
The historic Huerta de Valencia irrigation system faces water scarcity and inefficient distribution. Traditional management lacks real-time data, making it difficult to optimize water use while preserving centuries-old agricultural practices.
Our Solution
We deployed an IoT sensor network integrated with a custom dashboard that visualizes water flow, quality, and usage patterns in real-time. The system provides actionable insights for farmers and administrators, reducing water waste by 30% while respecting traditional irrigation schedules.
Collaborators
Our IoT Dashboard Packages
Explore our range of products and modules designed to enhance your 3D platform experience.
Essential Dashboard
Best for: Small teams, pilot projects, and internal monitoring
- Single data source integration
- Core KPI dashboard
- Read-only user roles
- Basic visualizations (charts, tables, status views)
- Secure backend setup
Typical timeframe: 1-2 months
Smart Dashboard
Best for: Institutions and operational teams needing deeper insights
- Everything in Essential, plus:
- Multiple data source integration
- Role-based access control
- Alerts and thresholds
- Historical data analysis
- Automated reports
- Map-based visualizations (if needed)
Typical timeframe: 3-4 months
Data Platform
Best for: Organizations building scalable, SaaS-ready systems
- Real-time data pipelines
- Sensor network integration and management
- Custom APIs and data exports
- White-label-ready frontend
- Multi-organization architecture
- SaaS-capable backend infrastructure
- Long-term scalability and performance design
Typical timeframe: 5-6 months
Interested in building a data monitoring platform?
Let's discuss your data sources, monitoring needs, and organizational workflows to design a scalable dashboard solution that supports real-time decision-making and long-term operational efficiency.
Get in touchFrequently Asked Questions
Not what you're looking for?